Probes
Configure health probes
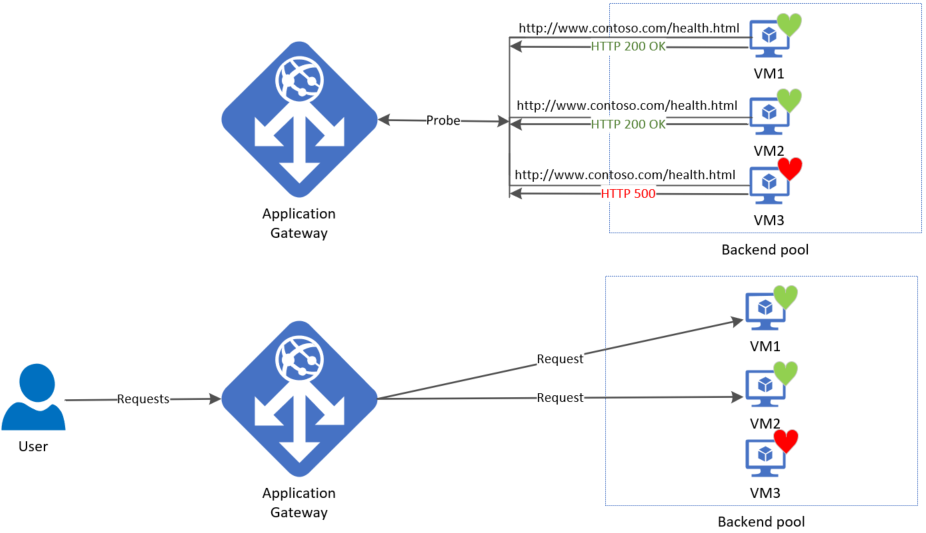
Azure Application Gateway by default monitors the health of all resources in its back-end pool and automatically removes any resource considered unhealthy from the pool. Application Gateway continues to monitor the unhealthy instances and adds them back to the healthy back-end pool once they become available and respond to health probes. By default, Application gateway sends the health probes with the same port that is defined in the back-end HTTP settings. A custom probe port can be configured using a custom health probe.
The source IP address that the Application Gateway uses for health probes depends on the backend pool:
If the server address in the backend pool is a public endpoint, then the source address is the application gateway's frontend public IP address. If the server address in the backend pool is a private endpoint, then the source IP address is from the application gateway subnet's private IP address space.

Default health probe
An application gateway automatically configures a default health probe when you don't set up any custom probe configurations. The monitoring behavior works by making an HTTP GET request to the IP addresses or FQDN configured in the back-end pool. For default probes if the backend http settings are configured for HTTPS, the probe uses HTTPS to test health of the backend servers.
For example: You configure your application gateway to use back-end servers A, B, and C to receive HTTP network traffic on port 80. The default health monitoring tests the three servers every 30 seconds for a healthy HTTP response with a 30 second timeout for each request. A healthy HTTP response has a status code between 200 and 399. In this case, the HTTP GET request for the health probe looks like http://127.0.0.1/.
If the default probe check fails for server A, the application gateway stops forwarding requests to this server. The default probe continues to check for server A every 30 seconds. When server A responds successfully to one request from a default health probe, application gateway starts forwarding the requests to the server again.
Default health probe settings
| Probe property | Value | Description |
|---|---|---|
| Probe URL | <protocol>://127.0.0.1:<port>/ | The protocol and port are inherited from the backend HTTP settings to which the probe is associated |
| Interval | 30 | The amount of time in seconds to wait before the next health probe is sent. |
| Time-out | 30 | The amount of time in seconds the application gateway waits for a probe response before marking the probe as unhealthy. If a probe returns as healthy, the corresponding backend is immediately marked as healthy. |
| Unhealthy threshold | 3 | Governs how many probes to send in case there's a failure of the regular health probe. In v1 SKU, these additional health probes are sent in quick succession to determine the health of the backend quickly and don't wait for the probe interval. In the case of v2 SKU, the health probes wait the interval. The back-end server is marked down after the consecutive probe failure count reaches the unhealthy threshold. |
Probe intervals
All instances of Application Gateway probe the backend independent of each other. The same probe configuration applies to each Application Gateway instance. For example, if the probe configuration is to send health probes every 30 seconds and the application gateway has two instances, then both instances send the health probe every 30 seconds.
If there are multiple listeners, then each listener probes the backend independent of each other.
Custom health probe
Custom probes give you more granular control over the health monitoring. When using custom probes, you can configure a custom hostname, URL path, probe interval, and how many failed responses to accept before marking the back-end pool instance as unhealthy, etc.
Custom health probe settings
| Probe property | Description |
|---|---|
| Name | Name of the probe. This name is used to identify and refer to the probe in back-end HTTP settings. |
| Protocol | Protocol used to send the probe. This property must match with the protocol defined in the back-end HTTP settings it is associated to |
| Host | Host name to send the probe with. In v1 SKU, this value is used only for the host header of the probe request. In v2 SKU, it is used both as host header and SNI |
| Path | Relative path of the probe. A valid path starts with '/' |
| Port | If defined, this property is used as the destination port. Otherwise, it uses the same port as the HTTP settings that it is associated to. This property is only available in the v2 SKU |
| Interval | Probe interval in seconds. This value is the time interval between two consecutive probes |
| Time-out | Probe time-out in seconds. If a valid response isn't received within this time-out period, the probe is marked as failed |
| Unhealthy threshold | Probe retry count. The back-end server is marked down after the consecutive probe failure count reaches the unhealthy threshold |
Probe matching
By default, an HTTPs response with status code between 200 and 399 is considered healthy. Custom health probes additionally support two matching criteria. Matching criteria can be used to optionally modify the default interpretation of what makes a healthy response.
The following are matching criteria:
HTTP response status code match - Probe matching criterion for accepting user specified http response code or response code ranges. Individual comma-separated response status codes or a range of status code is supported.
HTTP response body match - Probe matching criterion that looks at HTTP response body and matches with a user specified string. The match only looks for presence of user specified string in response body and isn't a full regular expression match.
Match criteria can be specified using the New-AzApplicationGatewayProbeHealthResponseMatch cmdlet.
 1500bytes